|
In this section, we will discuss the results of the constrained
molecular dynamics simulations performed to study the CH![]() Cl +
Cl
Cl +
Cl![]() reaction in a dilute aqueous solution of HCl. To obtain the
free energy barrier
reaction in a dilute aqueous solution of HCl. To obtain the
free energy barrier ![]() , we calculated the mean force of constraint
, we calculated the mean force of constraint
![]() at 5 points (
at 5 points (
![]() )
along the reaction coordinate
)
along the reaction coordinate ![]() (Eqn. 2). As a
verification of the simulations,
(Eqn. 2). As a
verification of the simulations,
![]() was also calculated at three points at the product
side of the reaction coordinate (
was also calculated at three points at the product
side of the reaction coordinate (
![]() ). Subsequently, two extra simulations were performed
for the points
). Subsequently, two extra simulations were performed
for the points ![]() (because at
(because at ![]() there was still
too large an attraction between CH
there was still
too large an attraction between CH![]() Cl and Cl
Cl and Cl![]() , whereas for the
separated reactants, the interaction between the reactants is expected
approach to zero
, whereas for the
separated reactants, the interaction between the reactants is expected
approach to zero![]() and at
and at ![]() (where we expected an extremum in
(where we expected an extremum in
![]() , after having fitted the
first five points).
, after having fitted the
first five points).
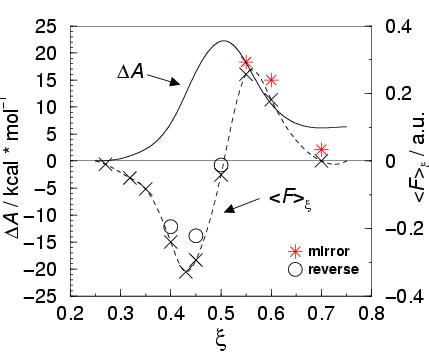
The results for the mean force of constraint are plotted in figure 3.5
(and listed in table 3.8).
The dashed line is a cubic spline fitted to
the calculated points. Integration of the mean force of constraint
with respect to ![]() (according to equation 3.7)
results in the free energy barrier, shown by the solid line in the
figure, yielding a barrier height of 22.2 kcal/mol. Taking into
account the 8 kcal/mol error in the gas phase reaction, the free
energy barrier of the reaction in aqueous solution would be
30.2 kcal/mol; an overestimation of about 3.6 kcal/mol compared to the
experimental result of 26.6 kcal/mol [66].
(according to equation 3.7)
results in the free energy barrier, shown by the solid line in the
figure, yielding a barrier height of 22.2 kcal/mol. Taking into
account the 8 kcal/mol error in the gas phase reaction, the free
energy barrier of the reaction in aqueous solution would be
30.2 kcal/mol; an overestimation of about 3.6 kcal/mol compared to the
experimental result of 26.6 kcal/mol [66].
Because of the symmetry of the reaction the calculated energy profile
should be symmetric. From the figure, it is obvious that the shape has
a significant asymmetry.
This asymmetry has been illustrated by asterisks in the figure. They
have been drawn in figure 3.5 above the three
points at the product side of the reaction (
![]() ) to picture the equivalent points at the reactant side (with
the negative force) for comparison. Moreover, the mean force of
constraint does not vanish at the transition state
) to picture the equivalent points at the reactant side (with
the negative force) for comparison. Moreover, the mean force of
constraint does not vanish at the transition state ![]() as it
should. The three product-side points as well as the point at the
transition state apply to
as it
should. The three product-side points as well as the point at the
transition state apply to
![]() configurations with a driving force
that is smaller toward the product-side (or larger toward the
reactant-side) than was expected from the other points at the
reactant-side. This can be characterized as hysteresis when forcing
the reaction by the method of constraint. Most likely, this hysteresis
is due to the surrounding water shell, which apparently adapts too
slowly to the changing reactants configuration, when going from one
simulation to the next by increasing
configurations with a driving force
that is smaller toward the product-side (or larger toward the
reactant-side) than was expected from the other points at the
reactant-side. This can be characterized as hysteresis when forcing
the reaction by the method of constraint. Most likely, this hysteresis
is due to the surrounding water shell, which apparently adapts too
slowly to the changing reactants configuration, when going from one
simulation to the next by increasing ![]() .
.
To test this explanation, we performed calculations
for the reversing of the reaction.
We performed the backward reaction for three points (
![]() ), where we started from the constrained MD run at
), where we started from the constrained MD run at
![]() and moved the constraint value slowly to the previous point
on the reaction coordinate. Subsequently, we equilibrated for 2.5 ps,
collected the force of constraint for 3 ps, and moved on to the next
point, similar to the points of the forward reaction direction. The
results are shown by the circles in figure 3.5.
The hysteresis at the first point,
and moved the constraint value slowly to the previous point
on the reaction coordinate. Subsequently, we equilibrated for 2.5 ps,
collected the force of constraint for 3 ps, and moved on to the next
point, similar to the points of the forward reaction direction. The
results are shown by the circles in figure 3.5.
The hysteresis at the first point, ![]() , has disappeared since
, has disappeared since
![]() is zero (within the error in the force), as expected.
Apparently, the solvent configuration is not pulling on either side
of the reacting complex, at this point.
For the other two points, we now find smaller absolute values for the
mean force of constraint than we found in the forward reaction. This
is consistent with the picture of a ``memory effect'' in the solvent,
i.e. a too slow adaptation of the water configuration to the changed
reaction coordinate.
is zero (within the error in the force), as expected.
Apparently, the solvent configuration is not pulling on either side
of the reacting complex, at this point.
For the other two points, we now find smaller absolute values for the
mean force of constraint than we found in the forward reaction. This
is consistent with the picture of a ``memory effect'' in the solvent,
i.e. a too slow adaptation of the water configuration to the changed
reaction coordinate.
A rough estimate of the systematic error on the free energy barrier
due to the hysteresis can be made, by assuming that the deviation in
the force will increase linearly
from zero at the starting point of the separate reactants (
![]() )
to the observed -0.041 a.u.
at the transition state. Correcting the free energy profile for the corresponding
overestimation (3.2 kcal/mol), gives a barrier height of 27 kcal/mol.
The excellent agreement with experiment (26.6 kcal/mol), after the corrections
for the DFT-GGA error in the gas phase transition state energy and the hysteresis
in the constrained MD runs, must be a bit fortuitous, for the following
reasons. First of all we have found the accuracy of the DFT-BP description
of the energetics of the solvation to be of the order of 1 kcal/mol.
Secondly, the experimental result refers to more dilute
solution at neutral pH, with typically potassium used for the counter cation.
In the present calculation, a proton acted as counter-cation, which
can be expected to have some influence on the energetics of the reaction via
its charge and solvation structure.
)
to the observed -0.041 a.u.
at the transition state. Correcting the free energy profile for the corresponding
overestimation (3.2 kcal/mol), gives a barrier height of 27 kcal/mol.
The excellent agreement with experiment (26.6 kcal/mol), after the corrections
for the DFT-GGA error in the gas phase transition state energy and the hysteresis
in the constrained MD runs, must be a bit fortuitous, for the following
reasons. First of all we have found the accuracy of the DFT-BP description
of the energetics of the solvation to be of the order of 1 kcal/mol.
Secondly, the experimental result refers to more dilute
solution at neutral pH, with typically potassium used for the counter cation.
In the present calculation, a proton acted as counter-cation, which
can be expected to have some influence on the energetics of the reaction via
its charge and solvation structure.
|
|
||||
| Attacking chloride | Leaving chloride | |||
|
|
|
|
|
|
|
|
||||
| 0.27 | 5.4 | 6.3 | - | - |
|
|
||||
| 0.32 | 4.3 | 5.1 | - | - |
|
|
||||
| 0.35 | 4.9 | 4.6 | - | - |
|
|
||||
| 0.40 | 4.7 | 4.4 | - | - |
|
|
||||
| 0.43 | 4.8 | 4.8 | - | - |
|
|
||||
| 0.45 | 4.2 | 4.5 | 1.1 | 4.4 |
|
|
||||
| 0.50 | 3.3 | 4.3 | 2.7 | (4.8) |
|
|
||||
| 0.50 |
2.9 | (5.6) | 3.0 | (4.3) |
|
|
||||
| 0.55 | 2.2 | (4.8) | 4.0 | 5.0 |
|
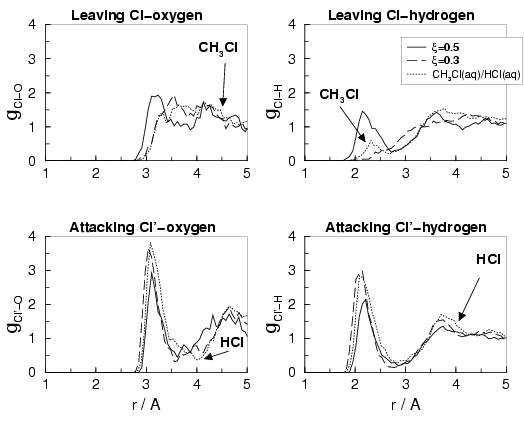
To start with the separated reactants at ![]() , we note that
the distribution functions
, we note that
the distribution functions
![]() and
and
![]() of the attacking
chloride anion (dashed lines in the lower graphs) are
very similar to the functions of pure HCl in water (dotted lines; see also
figure 3.3). The distribution around the leaving chloride
atom at
of the attacking
chloride anion (dashed lines in the lower graphs) are
very similar to the functions of pure HCl in water (dotted lines; see also
figure 3.3). The distribution around the leaving chloride
atom at ![]() (upper two graphs) is in agreement with pure CH
(upper two graphs) is in agreement with pure CH![]() Cl
in water (dotted lines), except for a small peak in
Cl
in water (dotted lines), except for a small peak in
![]() at
at ![]() Å in the latter. The small peak in the pure CH
Å in the latter. The small peak in the pure CH![]() Cl solution
(case b) in section 3.2.4) can be attributed
to one water molecule which is hydrogen bonded to the Cl of methylchloride.
The main reason for the absence of this peak in
Cl solution
(case b) in section 3.2.4) can be attributed
to one water molecule which is hydrogen bonded to the Cl of methylchloride.
The main reason for the absence of this peak in
![]() of the
leaving Cl, must be the presence of the Cl
of the
leaving Cl, must be the presence of the Cl![]() anion, which has a strong
influence on the solvent structure.
The coordination numbers (in table 3.7) shows that
the attacking chloride anion is solvated by about five water molecules, whereas
the separate CH
anion, which has a strong
influence on the solvent structure.
The coordination numbers (in table 3.7) shows that
the attacking chloride anion is solvated by about five water molecules, whereas
the separate CH![]() Cl does not show any attraction of water atoms. Note
that
Cl does not show any attraction of water atoms. Note
that
![]() confirms that this starting
constrained simulation indeed does not fully resemble separated reactants
as concluded in section 3.3.4,
whereas the extra simulation of
confirms that this starting
constrained simulation indeed does not fully resemble separated reactants
as concluded in section 3.3.4,
whereas the extra simulation of ![]() shows coordination numbers of
5.4 and 6.3 in agreement with the values for the pure HCl in water (5.2 and
6.5, table 3.5).
shows coordination numbers of
5.4 and 6.3 in agreement with the values for the pure HCl in water (5.2 and
6.5, table 3.5).
Next, we discuss the radial distribution functions for the transition state
configurations (solid lines).
These show a more equal solvation of the attacking and
leaving chloride ions. However, the first peaks of the
attacking chloride ion are still much more pronounced than the peaks
arising from the first solvation shell around the leaving
chloride. Also, the minimum at ![]() Å is much deeper in
Å is much deeper in
![]() than in
than in
![]() . This asymmetry in
the chloride solvation is reflected less strongly in the coordination
numbers (table 3.7).
The attacking chloride still has on average 3.3 hydrogens in
the first shell, while the leaving chloride has only 2.7.
The Cl-O coordination numbers cannot be determined accurately because
the oxygen distribution function
. This asymmetry in
the chloride solvation is reflected less strongly in the coordination
numbers (table 3.7).
The attacking chloride still has on average 3.3 hydrogens in
the first shell, while the leaving chloride has only 2.7.
The Cl-O coordination numbers cannot be determined accurately because
the oxygen distribution function
![]() of the leaving Cl
does not show an unambiguous minimum. Still, from the hydrogen distribution,
we can conclude that the attacking Cl is stronger solvated than the leaving
Cl, at
of the leaving Cl
does not show an unambiguous minimum. Still, from the hydrogen distribution,
we can conclude that the attacking Cl is stronger solvated than the leaving
Cl, at ![]() , which must be the grounds for the effective force of
constraint at the transition state.
Indeed, in the reversed reaction direction, where we found the expected
, which must be the grounds for the effective force of
constraint at the transition state.
Indeed, in the reversed reaction direction, where we found the expected
![]() , we also see a more symmetric
hydrogen distribution (radial distribution functions not shown)
and coordination number: 2.9 for the attacking Cl and 3.0 for the leaving Cl.
Just before the transition state, the leaving chloride has only one hydrogen in the
``first shell'' (
, we also see a more symmetric
hydrogen distribution (radial distribution functions not shown)
and coordination number: 2.9 for the attacking Cl and 3.0 for the leaving Cl.
Just before the transition state, the leaving chloride has only one hydrogen in the
``first shell'' (
![]() ), whereas just
after the transition state the attacking chloride still has two
hydrogens (
), whereas just
after the transition state the attacking chloride still has two
hydrogens (
![]() ). This difference
leads to a larger value for the mean force of constraint at
). This difference
leads to a larger value for the mean force of constraint at ![]() in comparison with
in comparison with ![]() , and gives a structural explanation for
the observed hysteresis in the free energy profile of
figure 3.5.
, and gives a structural explanation for
the observed hysteresis in the free energy profile of
figure 3.5.