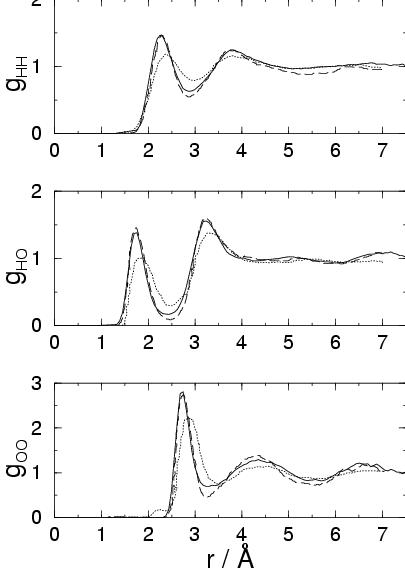
The last two test cases, before actually treating the S![]() 2 reaction,
deal with CP-PAW molecular dynamics simulations of water and hydrochloric acid (HCl)
in water (i.e. cases (a) and (d) in section 3.2.4.
The pure water sample consisted of 32 water molecules in a periodic cubic box with
an edge of 9.8650 Å, which was taken from a previous empirical force-field MD
simulation. After equilibrating for 15 ps to obtain natural distributions
for the atomic positions and velocities at
2 reaction,
deal with CP-PAW molecular dynamics simulations of water and hydrochloric acid (HCl)
in water (i.e. cases (a) and (d) in section 3.2.4.
The pure water sample consisted of 32 water molecules in a periodic cubic box with
an edge of 9.8650 Å, which was taken from a previous empirical force-field MD
simulation. After equilibrating for 15 ps to obtain natural distributions
for the atomic positions and velocities at ![]() K, we computed a trajectory
of 8.6 ps, from which some structure and dynamics parameters for liquid water
were calculated.
The hydrochloric acid sample was obtained from the equilibrated water
sample by inserting one HCl molecule and scaling the cubic box up to an edge of
9.9684 Å to yield the experimental density of a 1:32 ratio of HCl to
H
K, we computed a trajectory
of 8.6 ps, from which some structure and dynamics parameters for liquid water
were calculated.
The hydrochloric acid sample was obtained from the equilibrated water
sample by inserting one HCl molecule and scaling the cubic box up to an edge of
9.9684 Å to yield the experimental density of a 1:32 ratio of HCl to
H![]() O molecules (1.66M) solution.
The equilibration time for the HCl and 32 water molecules system was 10 ps and
the following 7.7 ps of trajectory was again used for analysis.
O molecules (1.66M) solution.
The equilibration time for the HCl and 32 water molecules system was 10 ps and
the following 7.7 ps of trajectory was again used for analysis.

|
|
|
|||||
|
|
|||||
|
|
|||||
| CP-PAW | 1.73 | 1.78 | 2.72 | 4.10 | 1.3 |
|
|
|||||
| SHP |
2.72 | 3.9 |
0.35 |
||
|
|
|||||
| MC/MD(TIP4p) | 1.9 |
1.9 |
2.75 |
5.1 |
3.3 |
|
|
|||||
| MD(SSD) |
1.9 | 2.0 | 2.75 | 5.2 | 2.24 |
|
|
|||||
| neutr. diff. |
1.9 | 1.6-1.9 | 2.86 | 5.3 | |
|
|
|||||
| X-ray |
2.7-2.8 | 4.3 |
The self-diffusion
coefficient ![]() in the pure water sample was calculated from the
mean-square displacement. Due to the short simulated trajectory of
8.6 ps, the statistical error, estimated from 1 ps block averages, is
relatively very high. Our result of
in the pure water sample was calculated from the
mean-square displacement. Due to the short simulated trajectory of
8.6 ps, the statistical error, estimated from 1 ps block averages, is
relatively very high. Our result of
![]() cm
cm![]() /s lies between the experimental value[115] of
/s lies between the experimental value[115] of
![]() cm
cm![]() /s and the value of
/s and the value of
![]() cm
cm![]() /s from the
CP-MD simulation of ref SHP.
/s from the
CP-MD simulation of ref SHP.

|
AIMD simulations of aqueous HCl solutions have been reported earlier
by Laasonen and Klein [117,118]. They considered systems
of similar size (32 molecules) at various concentrations, the most dilute one
(mole ratio 1:31) comparable to ours. However, they focused on the
dissociation and the effect of concentration and reported only little on
structural properties. As far as comparison was possible, their results
agree within the statistical error margins with our findings. Aqueous
HCl solutions have also been studied by molecular simulation using
(semi-)empirical force fields. Here we can distinguish between simple
non-polarizable[119] and more advanced
polarizable[116] water models. Note that the force-field
studies considered solvation of a single Cl![]() , leaving out the H
, leaving out the H![]() counter-ion. A comparison with our results is therefore only possible to a
limited extent.
counter-ion. A comparison with our results is therefore only possible to a
limited extent.
|
|
||||
|
|
|
|
|
|
|
|
||||
|
|
||||
| CP-PAW | 2.11 | 5.2 | 3.09 | 6.5(7.2) |
|
|
||||
| MC/TIP4p |
2.25 | 7.0 | 3.21 | 7.4 |
|
|
||||
| MD/TIP4p |
2.34 | 7.0 | 3.27 | 7.2 |
|
|
||||
| MD/pol. |
2.25 | 5.9 | 3.18 | 6.1 |
|
|
||||
| neutr. diff. |
2.22-2.26 | - | 3.20-3.34 | 5.3-6.2 |
|
|
||||
| X-ray |
- | - | 3.10-3.35 | 5-11 |
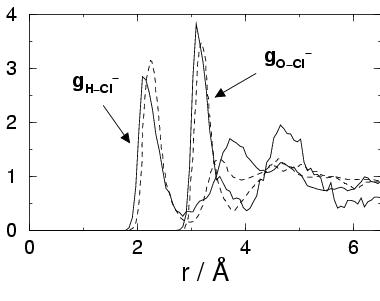
The coordination numbers listed in table 3.5 show that in
our AIMD simulation Cl![]() has on average 5 hydrogen bonds, in good
agreement with the findings of the CP-MD simulation of
ref LaKl97 and the simulation with the advanced polarizable
force field. Note that the non-polarizable force field overestimates
the coordination of the hydrogens significantly.
The oxygen coordination number from our AIMD simulation of 7.2 exceeds
the results of the polarizable force field simulation by 1.1.
Also the comparison with the experimental[122] range of 5.3-6.2
indicates an overestimate. The large value is due to the shoulder feature on
the right of the first peak of the
has on average 5 hydrogen bonds, in good
agreement with the findings of the CP-MD simulation of
ref LaKl97 and the simulation with the advanced polarizable
force field. Note that the non-polarizable force field overestimates
the coordination of the hydrogens significantly.
The oxygen coordination number from our AIMD simulation of 7.2 exceeds
the results of the polarizable force field simulation by 1.1.
Also the comparison with the experimental[122] range of 5.3-6.2
indicates an overestimate. The large value is due to the shoulder feature on
the right of the first peak of the
![]() radial distribution function.
Inspections of snapshots
indicates that the first solvation shell contains on average one water molecule
that is not hydrogen bonded to the Cl
radial distribution function.
Inspections of snapshots
indicates that the first solvation shell contains on average one water molecule
that is not hydrogen bonded to the Cl![]() ion. Again this
feature might be attributed to the presence of the H
ion. Again this
feature might be attributed to the presence of the H![]() cation in
the second solvation shell.
cation in
the second solvation shell.
The excess proton is associated with a single water molecule,
forming H![]() O
O![]() in approximately 70% of the time, and shared between
two water molecules, forming a
in approximately 70% of the time, and shared between
two water molecules, forming a
![]() complex in approximately 30%
of the time. This is in agreement with the CP-MD results of Tuckerman
et al.[52,53], from their study of the solvation and
transport of H
complex in approximately 30%
of the time. This is in agreement with the CP-MD results of Tuckerman
et al.[52,53], from their study of the solvation and
transport of H![]() O
O![]() in water
at infinite dilution with 60% and 40% abundancies of
the H
in water
at infinite dilution with 60% and 40% abundancies of
the H![]() O
O![]() and H
and H![]() O
O![]() hydronium complexes, respectively.
(see for the criteria to distinguish between the complexes
refs TLSP1 and TLSP2).
hydronium complexes, respectively.
(see for the criteria to distinguish between the complexes
refs TLSP1 and TLSP2).
This difference might be attributed to the presence
of the Cl![]() ion in our work. The water structure surrounding the hydronium complexes
is very similar to their results, which follows from the comparison of the radial
distribution functions (data not shown).
ion in our work. The water structure surrounding the hydronium complexes
is very similar to their results, which follows from the comparison of the radial
distribution functions (data not shown).
From the calculations of the gas phase structures and the preparatory AIMD simulations of water and dilute hydrochloric acid, we may conclude that our numerical approach, using DFT-BP together with the Car-Parrinello technique as implemented in the PAW method, yields results consistent with results reported in the literature. These results also confirm reports in the literature that the CP-MD method is able to reproduce properties of aqueous solutions with an acceptable accuracy. An important technical detail is that, for accuracies of 1 kcal/mol for the energies and 0.03 Å for bond lengths of the systems in this study, the plane wave basis set can be kept as small as a 30 Ry kinetic energy cutoff.