In this section, we will examine the solvent effects on the energetics
of the hydroxylation of methane by the ferryl ion in aqueous solution.
We have performed constrained molecular dynamics simulations to compute
the free energy barrier, using the method of thermodynamic integration
(see e.g. ref. frenkel_smit).
Since in vacuo the reaction barrier for the methane hydroxylation
was found to be much higher in the methane coordination mechanism (22.8 kcal/mol)
than in the oxygen-rebound mechanism (3.5 kcal/mol), the latter route
is especially interesting to study in aqueous solution; also, because the required
H![]() O/CH
O/CH![]() ligand exchange for the methane coordination mechanism adds an
extra endothermicy of 23.4 kcal/mol in vacuo.
On the other hand, one could argue that this ligand exchange reaction energy
would be much less endothermic in aqueous solution, due to the hydrophobic
repulsion between the methane substrate and the solvent in contrast to
the hydrophilic interaction between the water molecule and the solvent.
In principle, computation of the ligand exchange reaction (free) energy in
aqueous solution is possible, although cumbersome and a complicated reaction
coordinate would be required. Instead, using a simple bond constraint, the
interaction between the methane molecule and the iron site can be computed and
compared to the -6 kcal/mol attraction at an Fe-C distance of
ligand exchange for the methane coordination mechanism adds an
extra endothermicy of 23.4 kcal/mol in vacuo.
On the other hand, one could argue that this ligand exchange reaction energy
would be much less endothermic in aqueous solution, due to the hydrophobic
repulsion between the methane substrate and the solvent in contrast to
the hydrophilic interaction between the water molecule and the solvent.
In principle, computation of the ligand exchange reaction (free) energy in
aqueous solution is possible, although cumbersome and a complicated reaction
coordinate would be required. Instead, using a simple bond constraint, the
interaction between the methane molecule and the iron site can be computed and
compared to the -6 kcal/mol attraction at an Fe-C distance of
![]() Å in vacuo.
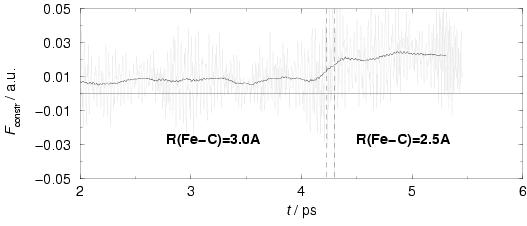
We therefore performed a short constrained molecular dynamics
simulation of this system (see e.g. the reactant complex structure in
figure 8.1) in water, with the Fe-C bond distance
constrained to 3.0 Å. The resulting average force of constraint is repulsive
by 0.008 a.u., and similarly, an average force of constraint equal to
0.022 a.u. is found for a Fe-C bond distance fixed at 2.5 Å
(see figure 8.4). The CH
Å in vacuo.
We therefore performed a short constrained molecular dynamics
simulation of this system (see e.g. the reactant complex structure in
figure 8.1) in water, with the Fe-C bond distance
constrained to 3.0 Å. The resulting average force of constraint is repulsive
by 0.008 a.u., and similarly, an average force of constraint equal to
0.022 a.u. is found for a Fe-C bond distance fixed at 2.5 Å
(see figure 8.4). The CH![]() molecule is thus repelled
from the iron coordination site in aqueous solution, so that we have concluded that
the methane coordination mechanism does not offer a viable route in aqueous
solution.
molecule is thus repelled
from the iron coordination site in aqueous solution, so that we have concluded that
the methane coordination mechanism does not offer a viable route in aqueous
solution.

|
Proceeding with the oxygen-rebound mechanism, we performed 9 subsequent
constrained molecular dynamics simulations at different points along the
reaction coordinate of the reaction
![\begin{displaymath}[({\rm H}_2{\rm O})_5{\rm Fe}^{\rm {IV}}{\rm O}]^{2+} + {\rm ...
...})_5{\rm Fe}^{\rm {III}}{\rm OH}]^{2+} + \mbox{\.{}}{\rm CH}_3
\end{displaymath}](img712.png) |
(83) |
The second term is the ratio of the projection of the O-H bond distance
onto the C-O axis and the C-O bond distance, which equals
![]() when the hydrogen is in the middle of the oxo ligand and the carbon.
For infinitely far separated reactants
when the hydrogen is in the middle of the oxo ligand and the carbon.
For infinitely far separated reactants ![]() goes to zero, and for
infinitely far separated products
goes to zero, and for
infinitely far separated products ![]() goes to one. Note that
goes to one. Note that ![]() for
for
![]() , for instance when forming methanol
and secondly,
, for instance when forming methanol
and secondly, ![]() if
if
![]() , for instance in freely
rotating CH
, for instance in freely
rotating CH![]() .
For our 9 MD simulations, we choose
.
For our 9 MD simulations, we choose
![]() . Each simulation started by bringing the constrained reaction coordinate
. Each simulation started by bringing the constrained reaction coordinate
![]() to the desired value during a short MD run, after which an equilibration MD
run followed of at least 2.5 ps to adapt the system to the new constraint
value, until there was no longer any drift in the fluctuating force of
constraint. We then sampled the force of constraint,
to the desired value during a short MD run, after which an equilibration MD
run followed of at least 2.5 ps to adapt the system to the new constraint
value, until there was no longer any drift in the fluctuating force of
constraint. We then sampled the force of constraint, ![]() , during
a 2 ps MD simulation. To correct
, during
a 2 ps MD simulation. To correct ![]() for the bias introduced by
imposing the constraint, which limits the sampling to a constrained NVT
ensemble, instead of the desired true NVT
ensemble, the true force of constraint
for the bias introduced by
imposing the constraint, which limits the sampling to a constrained NVT
ensemble, instead of the desired true NVT
ensemble, the true force of constraint ![]() was calculated using
was calculated using
 |
|||
 |
(85) |

|

|

|
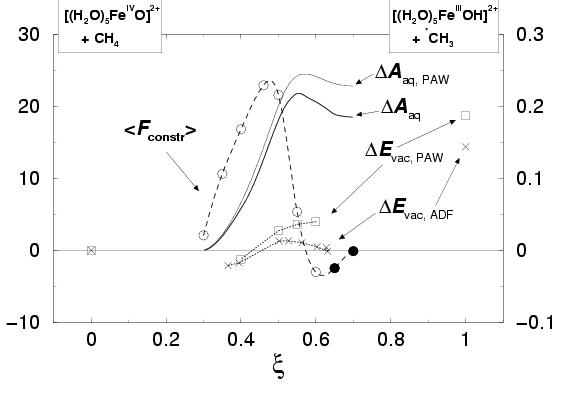
The results, the forces of constraint for nine points along the reaction
coordinate, are shown in figure 8.5, indicated by the open and closed
circles (and the right-hand-side axis) and fitted with a quadratic spline
(dashed line).
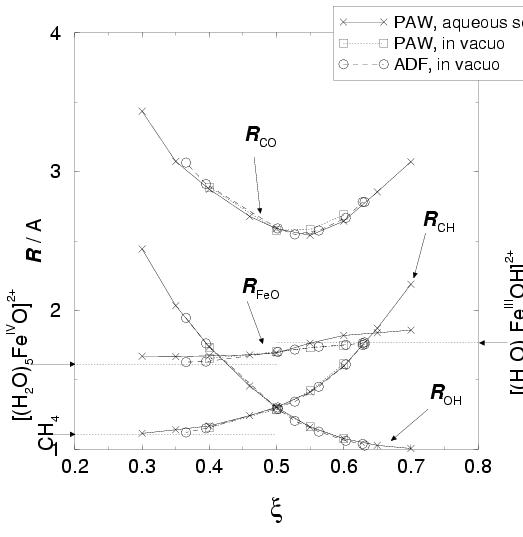
Due to the limited size of the supercell, the reaction coordinate value of
![]() is practically the largest possible separation of the reactants in
the box. The average distance between the oxo ligand and the methane carbon equals
is practically the largest possible separation of the reactants in
the box. The average distance between the oxo ligand and the methane carbon equals
![]() Å at this constraint value (see
figure 8.6, for the relevant average
inter-atomic distances,
Å at this constraint value (see
figure 8.6, for the relevant average
inter-atomic distances, ![]() ,
, ![]() ,
, ![]() , and
, and ![]() as a function of the reaction coordinate
as a function of the reaction coordinate ![]() ).
The average distance between the methane carbon and its hydrogen (that is
to be transferred to the oxo ligand) is
).
The average distance between the methane carbon and its hydrogen (that is
to be transferred to the oxo ligand) is
![]() Å at
Å at ![]() ,
which is almost equal to the other three average C-H bond distances (1.107 Å).
The interaction between the reactants at
,
which is almost equal to the other three average C-H bond distances (1.107 Å).
The interaction between the reactants at ![]() is indeed very small,
but not completely zero, as seen from the small value for the mean force of constraint
at
is indeed very small,
but not completely zero, as seen from the small value for the mean force of constraint
at ![]() in figure 8.5.
Moving along the reaction coordinate to larger
in figure 8.5.
Moving along the reaction coordinate to larger ![]() results initially in an increasing
repulsive force, which comes to a maximum at
results initially in an increasing
repulsive force, which comes to a maximum at ![]() and then decreases again
to cross the zero mean force of constraint at
and then decreases again
to cross the zero mean force of constraint at ![]() , which marks the transition
state. Initially, the reactants are just pulled towards each other, as shown
by the rapid decrease in the averages
, which marks the transition
state. Initially, the reactants are just pulled towards each other, as shown
by the rapid decrease in the averages ![]() and
and ![]() (see
figure 8.6). But beyond
(see
figure 8.6). But beyond ![]() , also
, also ![]() is seen to increase rapidly, indicating the transfer of the hydrogen from methane
to the oxo ligand. The average distance between the oxo ligand and the methane
carbon,
is seen to increase rapidly, indicating the transfer of the hydrogen from methane
to the oxo ligand. The average distance between the oxo ligand and the methane
carbon, ![]() , has its minimum at the transition state position of
, has its minimum at the transition state position of
![]() . During
the constrained MD simulation at
. During
the constrained MD simulation at ![]() and
and ![]() (distinguished by the
black filled circles in figure 8.5), the coordination number of
iron dropped by one to five,
as in both simulations one of the five water ligands left the coordination shell
and moved into the solvent. This event did not however have a significant effect
on the (running) force of constraint.
(distinguished by the
black filled circles in figure 8.5), the coordination number of
iron dropped by one to five,
as in both simulations one of the five water ligands left the coordination shell
and moved into the solvent. This event did not however have a significant effect
on the (running) force of constraint.
The Helmholtz free energy profile is obtained by integrating the mean force
of constraint with respect to ![]() :
:
 |
(86) |
The result is shown by the thin solid line in figure 8.5
(connected to the left-hand-side axis). We choose ![]() such that the free energy
equals zero for our most left-hand-side point,
such that the free energy
equals zero for our most left-hand-side point, ![]() . The bold solid line
shows the modified free energy profile,
. The bold solid line
shows the modified free energy profile,
![]() , for the hydrogen
abstraction from methane by the
ferryl ion in water, after correcting for the discrepancy between results for the
reaction energy of the hydrated complexes in vacuo obtained with the accurate
all-electron ADF computation and with the approximate PAW approach,
as explained in the method section 8.2. We have also plotted
these reaction energies of the hydrated complexes in vacuo
in figure 8.5 for comparison, using dotted lines and squares
(labeled
, for the hydrogen
abstraction from methane by the
ferryl ion in water, after correcting for the discrepancy between results for the
reaction energy of the hydrated complexes in vacuo obtained with the accurate
all-electron ADF computation and with the approximate PAW approach,
as explained in the method section 8.2. We have also plotted
these reaction energies of the hydrated complexes in vacuo
in figure 8.5 for comparison, using dotted lines and squares
(labeled
![]() ) and crosses (labeled
) and crosses (labeled
![]() ).
The reaction free energy barrier of 21.8 kcal/mol (with respect to the reactant
complex at
).
The reaction free energy barrier of 21.8 kcal/mol (with respect to the reactant
complex at ![]() ) is much higher than the zero-Kelvin energy barrier found
for the H-abstraction in vacuo of 3.4 kcal/mol. Including the temperature
dependent internal energy,
) is much higher than the zero-Kelvin energy barrier found
for the H-abstraction in vacuo of 3.4 kcal/mol. Including the temperature
dependent internal energy,
![]() kcal/mol,
and the entropy
contribution,
kcal/mol,
and the entropy
contribution,
![]() kcal/mol (see table 8.3)
to this latter number, results in a free energy barrier of 1.1 kcal/mol in vacuo,
making the difference in energetics even larger
kcal/mol (see table 8.3)
to this latter number, results in a free energy barrier of 1.1 kcal/mol in vacuo,
making the difference in energetics even larger![]() .
The large difference between the free energy profile in aqueous solution and the
reaction energy in vacuo is rather striking. Moving further to the product
side,
.
The large difference between the free energy profile in aqueous solution and the
reaction energy in vacuo is rather striking. Moving further to the product
side,
![]() slowly decreases again by 3.3 kcal/mol, to
18.5 kcal/mol with respect to the reactant state at
slowly decreases again by 3.3 kcal/mol, to
18.5 kcal/mol with respect to the reactant state at ![]() .
.
Clearly, the aqueous solution has a strong effect on the energetics of
the hydrogen abstraction reaction from methane by the ferryl ion. The hydration
of the iron complex and the methyl by the surrounding dipolar water molecules
plays an important role, as the charge distribution over the reactants changes
along the reaction coordinate, leading to changes in the solvation energy.
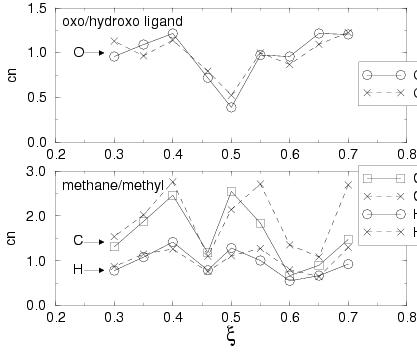
We have expressed
the hydration of the oxo atom and the carbon and its (three) hydrogens in
solvent coordination numbers, ![]() , by integrating the radial distribution functions
of these atoms with respect to the solvent hydrogens and solvent oxygens up to
certain radii. For the oxo/hydroxo ligand oxygen, the radial distributions,
, by integrating the radial distribution functions
of these atoms with respect to the solvent hydrogens and solvent oxygens up to
certain radii. For the oxo/hydroxo ligand oxygen, the radial distributions,
![]() and
and
![]() showed clear peaks due to the hydration by,
on average, one water molecule and the upper integration limit was therefore chosen at
the minimum after the peaks at
showed clear peaks due to the hydration by,
on average, one water molecule and the upper integration limit was therefore chosen at
the minimum after the peaks at
![]() Å and
Å and
![]() Å. For the methane/methyl carbon and hydrogens, the hydrophobic
solvation does not result in sharp peaks in the radial distribution functions, so that
here the integration limits were chosen arbitrarily to be
Å. For the methane/methyl carbon and hydrogens, the hydrophobic
solvation does not result in sharp peaks in the radial distribution functions, so that
here the integration limits were chosen arbitrarily to be
![]() Å,
Å,
![]() Å,
Å,
![]() Å, and
Å, and
![]() Å
(the subscript s meaning solvent and m meaning methyl).
Figure 8.7 shows these solvent coordination numbers
for the oxo/hydroxo ligand (upper graph) and the methane/methyl substrate
(lower graph).
Å
(the subscript s meaning solvent and m meaning methyl).
Figure 8.7 shows these solvent coordination numbers
for the oxo/hydroxo ligand (upper graph) and the methane/methyl substrate
(lower graph).
The hydration of the hydrogen abstracting oxygen shows a clear picture: at the
reactant side, the oxo ligand is coordinated by on average one water molecule
and at the product side the hydroxo ligand also accepts on average one (1.2)
hydrogen bond from a solvent molecule. In between, the hydration decreases
to a minimum of about 0.4 hydrogen bonded solvent molecule at ![]() .
This decrease is partly explained by the approaching methane which
disrupts the solvent structure around the oxo-ligand as the distance between
the oxygen and the methane carbon,
.
This decrease is partly explained by the approaching methane which
disrupts the solvent structure around the oxo-ligand as the distance between
the oxygen and the methane carbon, ![]() (figure 8.6) decreases. However, the oxo coordination
is not so small at
(figure 8.6) decreases. However, the oxo coordination
is not so small at ![]() and
and ![]() even though
even though ![]() is
still small. Most likely, the increased charge transfer (polarization)
in the transition state complex relative to the reactant complex which
we observed for the hydrated complexes in vacuo
(see table 8.4), also takes place during the
hydrogen transfer in solution. As a result the oxygen becomes more negative
in the transition state configuration (at
is
still small. Most likely, the increased charge transfer (polarization)
in the transition state complex relative to the reactant complex which
we observed for the hydrated complexes in vacuo
(see table 8.4), also takes place during the
hydrogen transfer in solution. As a result the oxygen becomes more negative
in the transition state configuration (at ![]() in aqueous solution)
and therefore more attractive for H-bond donating solvent molecules, hence
the increased coordination number at
in aqueous solution)
and therefore more attractive for H-bond donating solvent molecules, hence
the increased coordination number at ![]() and
and ![]() , compared
to
, compared
to ![]() .
.
The coordination number of the carbon (and methyl hydrogens) initially
increases, as the methane molecule becomes polarized when one
C-H becomes slightly elongated (lower graph in figure 8.7).
But again ![]() drops when the distance
between methane and the oxo ligand,
drops when the distance
between methane and the oxo ligand, ![]() , and part of the solvation
shell of methane has to make space for the oxo ligand to enter.
Also here, the minimum in
, and part of the solvation
shell of methane has to make space for the oxo ligand to enter.
Also here, the minimum in ![]() is again followed by a significant increase
which must be due to the increased (now positive) charge on CH
is again followed by a significant increase
which must be due to the increased (now positive) charge on CH![]() ,
which we also noticed in vacuo (table 8.4).
,
which we also noticed in vacuo (table 8.4).
Can the ferryl ion still be expected to be the active intermediate in oxidation reactions by Fenton's reagent? For the oxidation of methane in aqueous solution, the reaction free energy barrier of more than 20 kcal/mol for the rate determining step (i.e. the H-abstraction) is on the high side. However, as explained in the introduction, the reaction barrier for methane hydroxylation serves as an upper limit. The C-H bond energy in a more typical organic substrate, such as tartaric acid (as was used by H.J.H Fenton himself[128,155]) is in the order of 10 kcal/mol less than in methane. The remaining 10 kcal/mol for the barrier of the hydroxylation, is not very high at all, so that this result in combination with our previous work on the ferryl ion formation from Fenton's reagent leads us to conclude that the ferryl ion is indeed the most likely candidate for the active species in Fenton chemistry. Moreover, in most other solvents the screening effects will be less, which can now be expected to lower the barrier for the H-abstraction more.