In the original transition path sampling procedure, to determine the
transition state of a single reaction pathway, a large number of
trajectories have to be initiated with random initial atomic velocities
from some trial point along the pathway. From the ratio of the number of
trajectories that end in the reactant well and the number of trajectories
that end in the product well, it can be determined whether
the trial point is located on the reactant side or the product side of the
TS point. If more than 50 % of the trajectories ended in the reactant well,
a new trial point is chosen located at the product side of the previous point
(and vice versa), and this procedure
is repeated until the TS point is found for which 50 % of the trajectories
generated from this point end up in the reactant well and 50 % end up in the
product well. Unfortunately, this technique is computationally
very expensive in combination with Car-Parrinello MD for our system. Therefore,
we introduce an alternative strategy to speed up the search for the TS point.
Instead of branching off many trajectories from a trial point with
random initial
atomic velocities, we start one trajectory with zero atomic velocities.
The initial direction of the system is therefore determined by the potential
energy rather than the free energy, as was the case in the original
strategy. If the system
ends up in the reactant state, we try a new trial point located more to the
products side along the pathway and vice versa. Due to the low
temperature the system will have (starting from zero Kelvin) and since
mainly the starting direction of the generated trajectory is relevant,
a damped Nosé thermostat which heats up the system to ![]() K is
used to accelerate the search even more.
Since we are however interested in the free energy transition state position,
we will in the end nevertheless use the original generation procedure
to find the exact location, but our ``zero Kelvin'' approach provides
a very cheap means to obtain a good first guess for the expensive full
procedure.
K is
used to accelerate the search even more.
Since we are however interested in the free energy transition state position,
we will in the end nevertheless use the original generation procedure
to find the exact location, but our ``zero Kelvin'' approach provides
a very cheap means to obtain a good first guess for the expensive full
procedure.


|
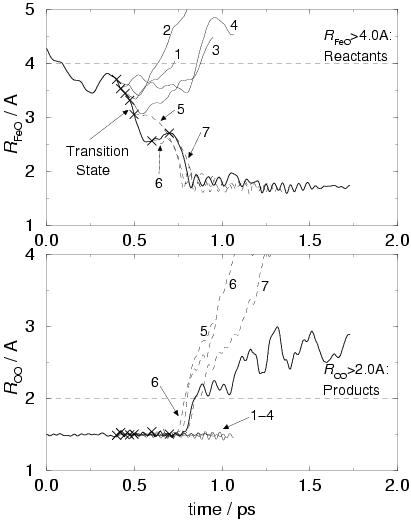
The left-hand-side graphs in figure 7.3, show the result
of our ``zero Kelvin'' approach to narrow down the TS position on our
initial pathway, defined in section 7.2, of the
reaction between pentaaqua iron(II) and hydrogen
peroxide in water. Note that the starting point of our initial path at
![]() ps in figure 7.1 has been set to
ps in figure 7.1 has been set to
![]() in figure 7.3.
The upper left-hand-side graph shows again the iron(II)
oxygen distance (bold line), which equals
in figure 7.3.
The upper left-hand-side graph shows again the iron(II)
oxygen distance (bold line), which equals
![]() Å
at the start at
Å
at the start at ![]() and decreases to
and decreases to
![]() Å 800
femtoseconds later, as hydrogen peroxide coordinates and bonds to iron
and the oxygen-oxygen bond breaks (which is shown in the lower graph).
The horizontal dashed lines depict our choice for the order parameters
that define the stable states. That is, for
Å 800
femtoseconds later, as hydrogen peroxide coordinates and bonds to iron
and the oxygen-oxygen bond breaks (which is shown in the lower graph).
The horizontal dashed lines depict our choice for the order parameters
that define the stable states. That is, for
![]() Å
the system finds itself in the reactant well of separated iron(II) and
hydrogen peroxide and for
Å
the system finds itself in the reactant well of separated iron(II) and
hydrogen peroxide and for
![]() Å the system finds
itself in the product well of dissociated hydrogen peroxide. Note that
this definition imposes no constraints--the final product may
consist of the OH. radical, a dihydroxo or oxo iron complex or
something we had not thought of yet.
Å the system finds
itself in the product well of dissociated hydrogen peroxide. Note that
this definition imposes no constraints--the final product may
consist of the OH. radical, a dihydroxo or oxo iron complex or
something we had not thought of yet.
The crosses on the bold line in both of the left-hand-side graphs denote the
trial points, from which trajectories were started with zero velocities.
We see that the trajectories originating from the first four trial points
all end up in the reactant well of
![]() Å (solid lines).
The trajectories of the next three points all end
up in the product state of
Å (solid lines).
The trajectories of the next three points all end
up in the product state of
![]() Å (dashed lines).
We have thus narrowed down the estimate for the TS location between
the fourth point at
Å (dashed lines).
We have thus narrowed down the estimate for the TS location between
the fourth point at ![]() ps (
ps (
![]() Å) and the fifth
point at
Å) and the fifth
point at ![]() ps (
ps (
![]() Å).
Å).
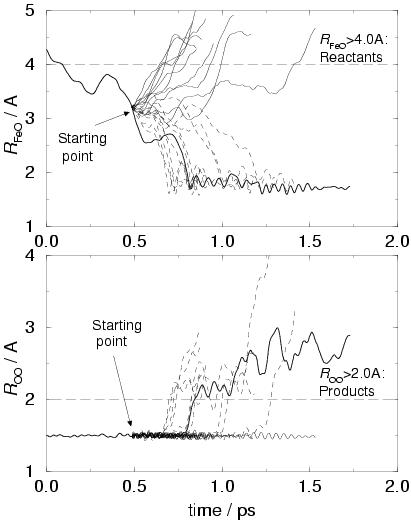
To verify this estimate of the TS location, we started 20 AIMD trajectories
at the point at ![]() ps (in the middle between point 4 and 5) where
the iron-oxygen separation is
ps (in the middle between point 4 and 5) where
the iron-oxygen separation is
![]() Å. The initial atomic
momenta were drawn from a gaussian (Boltzmann) distribution of a temperature
of
Å. The initial atomic
momenta were drawn from a gaussian (Boltzmann) distribution of a temperature
of ![]() K and corrected for any total momentum of the system.
In the right-hand-side graphs of figure 7.3, the 20
trajectories have been plotted. Ten of them end up in the reactant well
and the other ten end up in the product well. Perhaps a little fortuitously,
apparently our approach resulted in a very good estimate of the
transition state location on our reaction pathway, which could indicate
that the TS point on the free energy surface (sampled by the original
method, starting with random momenta) is not very different from the TS
point on the potential energy surface (which determines the TS position
resulting from our zero-Kelvin approach).
K and corrected for any total momentum of the system.
In the right-hand-side graphs of figure 7.3, the 20
trajectories have been plotted. Ten of them end up in the reactant well
and the other ten end up in the product well. Perhaps a little fortuitously,
apparently our approach resulted in a very good estimate of the
transition state location on our reaction pathway, which could indicate
that the TS point on the free energy surface (sampled by the original
method, starting with random momenta) is not very different from the TS
point on the potential energy surface (which determines the TS position
resulting from our zero-Kelvin approach).
The large iron-oxygen separation of
![]() Å and the
unchanged O-O distance in the transition state configuration indicates
that the barrier is mainly determined by the solvent environment for
our reaction pathway and not by the actual oxygen-oxygen lysis.
Earlier, we had inferred that this
barrier for hydrogen peroxide coordinated to iron(II) in aqueous
solution must be small in the PAW calculation as we observed the spontaneous
reaction to
the ferryl ion or to an iron(IV)dihydroxo complex, during AIMD
simulations[144,171]. Also in the present simulation the barrier for
O-O bond breaking is apparently small. It is possible that the barrier is
underestimated in the PAW calculation, in view of the overestimation of higher
oxidation states for iron as mentioned earlier in section 7.3.
In ADF calculations (STO basis functions) for the isolated complex we have
found a barrier, although a small one (6 kcal/mol), for the O-O lysis of the
coordinated hydrogen peroxide in the pentaaqua iron hydrogen peroxide complex.
The TS barrier in this case was found when the leaving O
Å and the
unchanged O-O distance in the transition state configuration indicates
that the barrier is mainly determined by the solvent environment for
our reaction pathway and not by the actual oxygen-oxygen lysis.
Earlier, we had inferred that this
barrier for hydrogen peroxide coordinated to iron(II) in aqueous
solution must be small in the PAW calculation as we observed the spontaneous
reaction to
the ferryl ion or to an iron(IV)dihydroxo complex, during AIMD
simulations[144,171]. Also in the present simulation the barrier for
O-O bond breaking is apparently small. It is possible that the barrier is
underestimated in the PAW calculation, in view of the overestimation of higher
oxidation states for iron as mentioned earlier in section 7.3.
In ADF calculations (STO basis functions) for the isolated complex we have
found a barrier, although a small one (6 kcal/mol), for the O-O lysis of the
coordinated hydrogen peroxide in the pentaaqua iron hydrogen peroxide complex.
The TS barrier in this case was found when the leaving O![]() H radical was
in the process of forming a bond to a H atom of an adjacent ligand, the calculations
in vacuo preventing it to go into solution.[145]
The TS position found in the present CPMD simulation in solution is clearly
connected to a barrier in the ligand coordination process. This can be understood
assuming that the approaching hydrogen
peroxide has to break (partially) with the energetically favorable
solvation shell before it can form an energetically favorable
bond with the iron complex. The correspondence between the methods to estimate the TS position (namely ``random momenta'' and ``zero-Kelvin'') can be understood in the same way when we also assume that the entropy loss due
to coordination is less important. For comparison, the free energy
barrier for exchange of a water molecule from the first coordination
shell of iron(II) in water was estimated to be 8.6 kcal/mol with
NMR spectroscopy, which is indeed mainly energetic (
H radical was
in the process of forming a bond to a H atom of an adjacent ligand, the calculations
in vacuo preventing it to go into solution.[145]
The TS position found in the present CPMD simulation in solution is clearly
connected to a barrier in the ligand coordination process. This can be understood
assuming that the approaching hydrogen
peroxide has to break (partially) with the energetically favorable
solvation shell before it can form an energetically favorable
bond with the iron complex. The correspondence between the methods to estimate the TS position (namely ``random momenta'' and ``zero-Kelvin'') can be understood in the same way when we also assume that the entropy loss due
to coordination is less important. For comparison, the free energy
barrier for exchange of a water molecule from the first coordination
shell of iron(II) in water was estimated to be 8.6 kcal/mol with
NMR spectroscopy, which is indeed mainly energetic (
![]() kcal/mol,
kcal/mol,
![]() kcal/mol)[215].
kcal/mol)[215].